

Introduction
In the relentless pursuit of operational excellence, every facet of a business comes under scrutiny. Inventory management, the lifeblood of smooth operations, is no exception. But simply stockpiling products isn’t enough. To optimize inventory, businesses must delve deeper, employing a variety of analytical techniques to understand, categorize, and optimize their stock. This is where inventory analysis comes in as a powerful tool that sheds light on stock patterns, identifies inefficiencies, and paves the way for informed inventory management decisions.
A Tour of Inventory Analysis Techniques
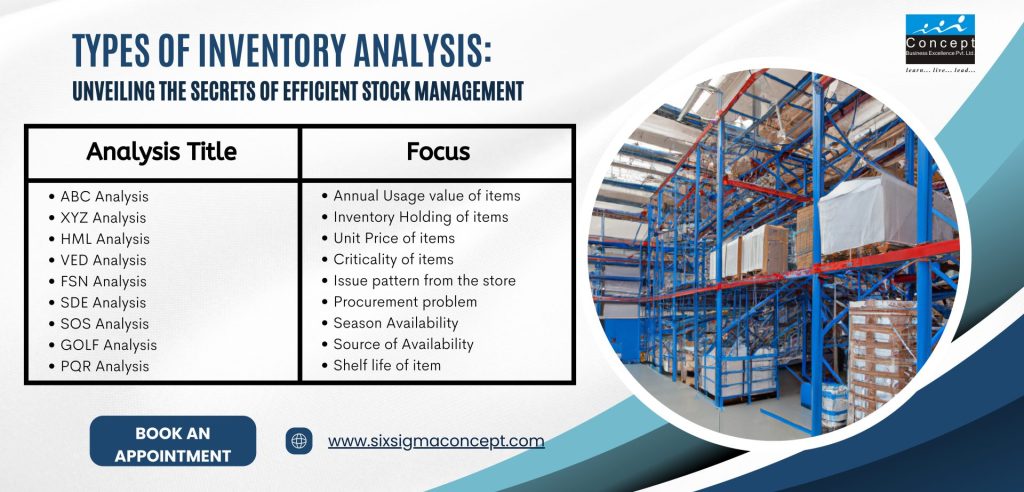
ABC (𝐀𝑙𝑤𝑎𝑦𝑠 𝐁𝑒𝑡𝑡𝑒𝑟 𝐂𝑜𝑛𝑡𝑟𝑜𝑙) Analysis
This popular method classifies inventory items based on their annual usage value. A-items constitute 20% of your inventory but account for 80% of your annual usage value. These critical items demand tight control and regular monitoring. B-items (15% of inventory, 15% of usage value) require moderate attention, while C-items (65% of inventory, 5% of usage value) can be managed less intensively.
XYZ Analysis
This technique focuses on inventory holding costs. X-items have high holding costs and low demand, necessitating careful control and potential reduction. Y-items have moderate holding costs and fluctuating demand, requiring moderate monitoring. Z-items have low holding costs and high demand, making them ideal for just-in-time stocking.
HML (𝐇𝑖𝑔ℎ-𝐌𝑒𝑑𝑖𝑢𝑚-𝐋𝑜𝑤) Analysis
This method categorizes inventory based on unit price. High-priced items (H) warrant stringent control and security measures. Medium-priced items (M) deserve moderate attention, while low-priced items (L) can be managed less tightly
VED (𝐕𝑖𝑡𝑎𝑙-𝐄𝑠𝑠𝑒𝑛𝑡𝑖𝑎𝑙-𝐃𝑒𝑠𝑖𝑟𝑎𝑏𝑙𝑒) Analysis
This analysis emphasizes the criticality of items to your business operations. Vital (V) items are essential for production or customer satisfaction and demand absolute priority. Essential (E) items are important but not irreplaceable, while Desirable (D) items are less critical and can be stocked based on budget constraints.
FSN (𝐅𝑎𝑠𝑡 𝑀𝑜𝑣𝑖𝑛𝑔-𝐒𝑙𝑜𝑤 𝑀𝑜𝑣𝑖𝑛𝑔-𝐍𝑜𝑛 𝑀𝑜𝑣𝑖𝑛𝑔) Analysis
This technique classifies inventory based on issue patterns. Fast-moving (F) items are frequently issued and necessitate close monitoring and readily available stock. Slow-moving (S) items require less frequent replenishment, while Non-moving (N) items may be obsolete or redundant and warrant potential removal.
SDE (𝐒𝑐𝑎𝑟𝑐𝑒-𝐃𝑖𝑓𝑓𝑖𝑐𝑢𝑙𝑡-𝐄𝑎𝑠𝑦) Analysis
This method focuses on procurement challenges. Scarce (S) items have long lead times and require proactive purchasing. Difficult (D) items have moderate lead times and may necessitate alternative sourcing strategies. Easily available (E) items pose minimal procurement challenges.
SOS (𝐒𝑒𝑎𝑠𝑜𝑛𝑎𝑙 – 𝐎𝑓𝑓 𝐒𝑒𝑎𝑠𝑜𝑛𝑎𝑙) Analysis
This technique is relevant for businesses with seasonal fluctuations in demand. Seasonal (S) items have predictable peaks and lows in demand, while Off-seasonal (O) items require careful management during low-demand periods.
GOLF Analysis
This method categorizes inventory based on source of availability. Government (G) items are subject to specific regulations and procurement procedures. Ordinary (O) items are readily available through regular suppliers. Local (L) items can be sourced domestically, while Foreign (F) items require international procurement.
PQR Analysis
This analysis focuses on the shelf life of inventory items. Perishable (P) items have limited shelf life and require strict inventory control to avoid spoilage. Quasi-perishable (Q) items have longer shelf lives but still require monitoring. Relatively non-perishable (R) items have extended shelf lives and can be managed with less urgency.
Conclusion
A Symphony of Insights for Inventory Optimization
Inventory analysis is not a one-size-fits-all approach. The most effective strategy often involves a harmonious blend of these techniques, tailored to your specific business needs and industry. By deciphering the language of your inventory through these analytical tools, you can unlock a wealth of insights, optimize stock levels, minimize holding costs, and ultimately achieve that elusive state of inventory nirvana.
Remember, effective inventory management is a continuous journey, not a one-time destination. So, embrace the power of inventory analysis, adapt your approach as needed, and watch your business soar to new heights of operational excellence.