

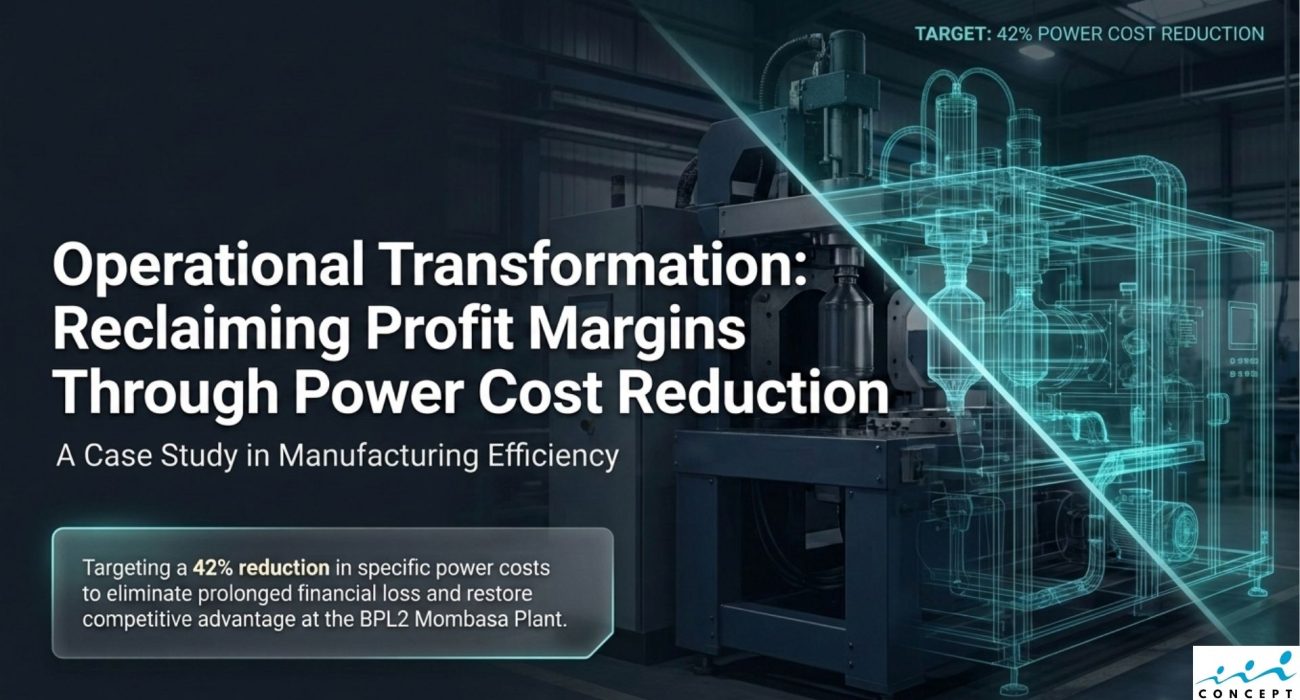
Targeting a 42% reduction in specific power costs to eliminate prolonged financial loss and restore competitive advantage at the BPL2 Mombasa Plant.
Insight: isolating these extremes directed the team’s Gemba walks (floor inspections) to prioritize three core failure points — mechanical leaks, thermal waste, and faulty measurement.
Individual machines showed even sharper gains — Machine 52 alone fell from 1.44 kWh/kg to 0.54 kWh/kg, and Machine 69 dropped to 0.54 kWh/kg, moving the fleet firmly on its trajectory toward the 42% cost-reduction target.
| TARGET: 42% POWER COST REDUCTION |
The Financial Drain
Power had quietly become the plant’s most expensive variable cost — and no one could say why. Average power consumption on the plant’s 10L and 20L blow-molding machines had climbed to 0.59 kWh/kg, significantly exceeding operational thresholds, inflating baseline production costs, and creating a prolonged competitive disadvantage. Engineering analysis set an achievable baseline target of 0.34 kWh/kg for optimal machine performance. Closing that 0.25 kWh/kg gap translated directly into a 42% reduction in overall power costs — margin that would flow straight to the bottom line, if the root causes could be found.| 0.59 kWh/kg Baseline power consumption — the financial drain | 0.34 kWh/kg Engineered target — the reclaimed margin |
Mapping the Process
Electricity is the plant’s primary variable cost input, flowing from the main grid through distribution boards and machine power panels into the heaters and motors that drive the blow-molding process. The diagnostic team mapped the full input-to-output chain — from raw material feed, through blow molding, to finished goods — pairing power-consumption data (kW/24hrs) directly against production yield (kg/24hrs) to isolate where energy was being wasted rather than converted into product.Building the Data Ecosystem
- Over 60 days of continuous shift data logged across nine 10L and 20L machines (January–February 2026), tracking units consumed versus production weight, using watt-hour meters and machine shot counters.
- Two-sample t-tests deployed to isolate variance across the fleet and separate genuine mechanical disparity from normal operating noise.
- Finding: performance gaps across the fleet were statistically significant and mechanical, not random — Machine 118 versus Machine 65 returned a p-value of 0.0000, proving systemic disparity between units doing the same job.
Isolating the Extremes: Best-of-Best vs. Worst-of-Worst
With variance confirmed as real, the team benchmarked the fleet’s best and worst performers side by side to see exactly what separated them.| Metric | Best of Best — M118 | Worst of Worst — M52 |
|---|---|---|
| Specific power (kWh/kg) | 0.23 | 1.10+ |
| Drive speed (Hz) | 25 Hz | 38.08 Hz (working harder) |
| Extruder RPM | 1,485 | 1,480 (yielding less) |
| Hydraulic motor power draw | 48.8 A | 21 A |
Triangulating the Invisible Waste
Three distinct — and compounding — sources of waste were diagnosed on the plant floor:Culprit 1 — Mechanical Waste: The Silent Drain of Hydraulic Leaks
Gemba floor verifications revealed significant hydraulic fluid leaks across seven of the nine machines (Machines 65, 118, 71, 79, 69, 75, and 52). Leaking fluid forces hydraulic pumps into constant, over-exerted operation to maintain clamping pressure (e.g., 1,400 psi). That mechanical friction translates directly into wasted kilowatt-hours and an artificially inflated cost-per-kg.Culprit 2 — Process Waste: Thermal Imbalance
Using standard HDPE processing rules (T-min + 0.6 × [T-max − T-min]), the engineered target melt temperature was tightly defined at 191°C across all eight heating zones. In practice, actual zone temperatures deviated from that baseline by as much as 50°C — some zones overheating while others ran cold. The heating elements were effectively fighting each other, forcing the electrical grid to supply continuous, wasted energy just to push under-melted resin through the extruder.Culprit 3 — Data Distortion: The Illusion
“You cannot manage what you mismeasure.” Machines 52 and 44 were logging disastrously high consumption readings (1.34+ kWh/kg), raising the question: was this mechanical failure, or a hallucinating meter? The team swapped a standard meter (validated on Machine 65 at 0.17 kWh/kg) onto Machine 52, which then read 0.32 kWh/kg, and onto Machine 44 with a similarly corrected result. The original meters were faulty, drastically over-counting consumption. Eliminating this data distortion let leadership see the true baseline and stop making decisions based on ghost data.The Transformation: Reclaiming the Baseline
By fixing hydraulic leaks, enforcing the 191°C thermal baseline, and replacing hallucinating energy meters, average specific power consumption across the 10L/20L fleet plummeted in a single month.| 0.55 kWh/kg Plant average — January/February baseline | 0.40 kWh/kg Plant average — March, after intervention |
Business Value & ROI Delivered
- Accuracy restored: eliminated blind spots in cost-tracking. Faulty gadgets were replaced, ensuring leadership makes decisions on verified, ground-truth data.
- Process stabilized: eradicated mechanical friction and thermal waste, extending equipment life by eliminating hydraulic leaks and stabilizing extruder workloads.
- Margin reclaimed: plant averages dropped from 0.55 to 0.40 kWh/kg in a single month — successfully trending toward the ultimate 42% cost-reduction target and moving the operation from financial bleed to competitive advantage.
Engineering Profitability
“Operational excellence isn’t just about keeping machines running — it’s about peeling back the layers to engineer pure profitability. Data-driven Six Sigma methodologies can uncover hidden margins in any facility.” Let’s connect to discuss how diagnostic rigor can transform your operational baseline.Request for Full Case Study.
Get access to the architecture diagrams and implementation blueprints.
Request Received Successfully!
Thank you for your interest. Our team will manually review your details and email the PPT presentation to your business address shortly.