

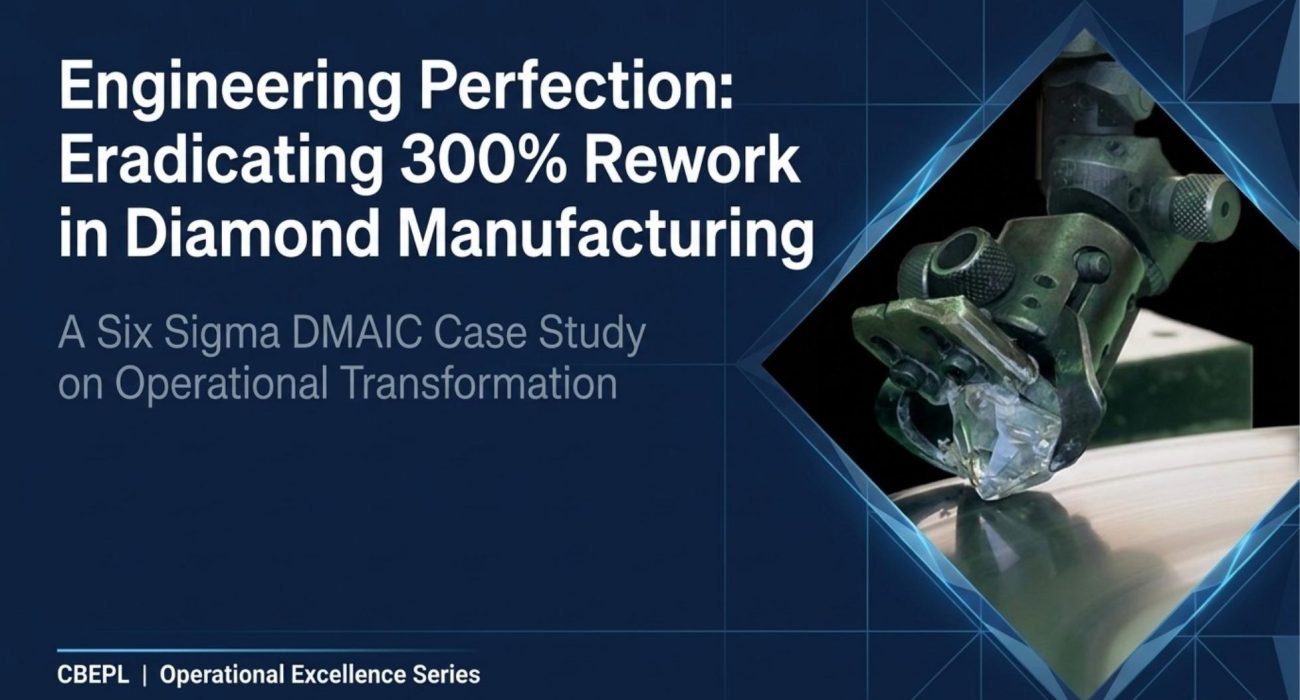
At a diamond manufacturing facility, the final polishing line had quietly become the most expensive room in the building. Not because of what it produced. Because of what it re-produced.
A sample of 680 stones told the story. The average diamond was going back for 3 separate repairs before it could pass. A 300% rework rate. Every stone, three times, every day.
The cost of that wasn’t a line item anyone had ever written down:
- 3.5 extra days added to the average production cycle — with some stones stuck for up to 17 days
- The most skilled polishers on the floor trapped in repair loops instead of processing new inventory
- 151.5 carats sitting frozen in the pipeline on any given day
- Labour, consumables and processing costs climbing with no matching output
Everyone on the floor knew there was a problem. Nobody could agree on the cause. Ask ten people and you got ten answers the wheel, the operators, the wage structure, the small stones, the graders.
That’s exactly the situation Six Sigma was built for.
45 Suspects. 7 Culprits.
The team ran a full DMAIC cycle on the polishing process. The Analyze phase started with 45 brainstormed variables — every theory anyone on the floor had ever offered.
Statistical validation cut that list to 7 root causes.
Some of them were uncomfortable. The scaif (polishing wheel) was being smoothed inconsistently, and different diamond grades were being run on the same equipment. The table polishing was being done by operators who had never specialised in it. And the microscope graders enforcing GIA standards had never actually polished a stone themselves.
One popular theory — that the wage structure was pushing operators to choose speed over quality — was tested and statistically invalidated. It got discarded. Which is the part most teams skip, and the part that saves the most money.
📄 Get the Full Case Study
Engineering Perfection: Eradicating a 300% Rework Rate A Six Sigma DMAIC Case Study — CBEPL Operational Excellence Series
Fill in the form below and the complete case study lands in your inbox in under a minute. No cost. No follow-up you didn’t ask for.
Inside the full document: ✔ All 7 statistically validated root causes ✔ The complete intervention map — tooling, process and manpower ✔ Before/after data dashboard with 13 weeks of control data ✔ Full ₹1.20 Cr financial impact breakdown ✔ The audit and control system that sustained the gains
Request for Full Case Study.
Get access to the architecture diagrams and implementation blueprints.
Request Received Successfully!
Thank you for your interest. Our team will manually review your details and email the PPT presentation to your business address shortly.