

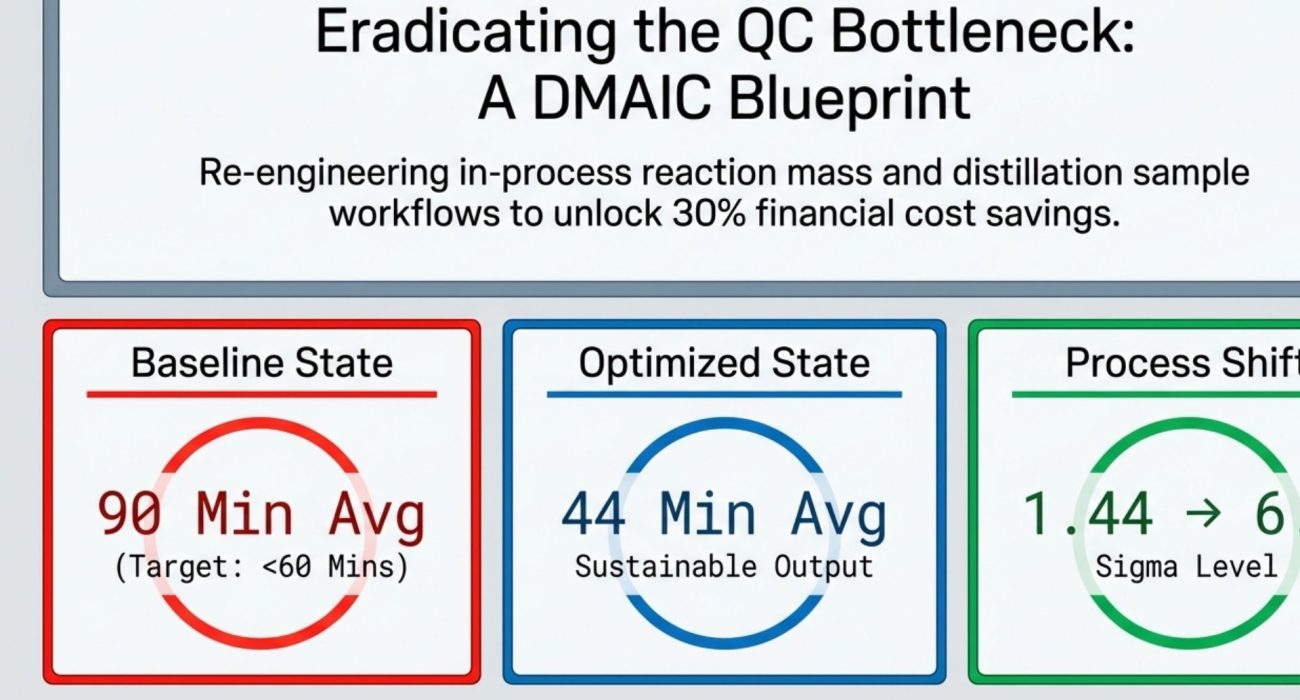
In chemical and process manufacturing, the Quality Control (QC) laboratory is vital for maintaining strict product standards. However, it can easily become an operational bottleneck. When in-process reaction mass and distillation samples experience testing delays, subsequent production processes stall. This idle time inflates labor costs, increases energy utilization, and restricts overall throughput.
This DMAIC case study examines how Gujarat Fluorochemicals Ltd, in collaboration with Concept Business Excellence, re-engineered its QC sample workflows to eliminate delays, optimize labor utility, and unlock 30% in direct operational cost savings.
1. Define & Measure: Identifying the Pain Points
The first step in any structured DMAIC case study is to define the boundaries of the problem and establish an accurate baseline of the current process.
The Pain Points (Symptom)
-
High Analysis Times: Sample analysis times averaged 90 minutes (with specific sample runs averaging 75 minutes), regularly exceeding the target threshold of <60 minutes.
-
Resource Inflation: Delays in results forced a 15% inflation in manpower requirements and a 30% increase in chemical and equipment utilization due to prolonged process holding times.
-
Scope Boundary: To keep the project focused, the scope was restricted strictly to in-process reaction mass and distillation samples. Raw materials and finished product samples were excluded from this phase.
Baseline Process Diagnostics
A statistical analysis of 295 samples revealed severe process instability:
-
Process Capability (
Cpk): -0.19 (indicating a process incapable of meeting requirements)
-
Defect Reality: 155 out of 295 samples failed to meet the <60-minute target.
-
Baseline Sigma Level: 1.44
2. Analyze: Separating Signal from Noise
Instead of immediately investing in expensive new laboratory hardware, the project team investigated procedural and behavioral root causes. During Gemba walks, the team brainstormed 34 potential causes of testing delays.
Using a “noise filter,” they set aside minor factors—such as glassware availability, instrument preventive maintenance schedules, and laboratory temperature controls—to focus on validated signals.
A Failure Mode and Effects Analysis (FMEA) prioritized these validated root causes by Risk Priority Number (RPN):
| Critical Risk Factor | Root Cause Mechanism | RPN Score |
| Two-Layer Samples | Outdated analytical methods/SOPs leading to extreme settling times | 384 |
| Bottle Contamination | Lack of a standardized bottle-cleaning protocol | 280 |
| Repetitive Samples | Out-of-specification results requiring re-runs | 192 |
| Unplanned Samples | Lack of alignment with production scheduling | 160 |
Diagnostic Insight: The analysis confirmed that the primary operational risks stemmed from procedural misalignment and communication gaps between Production and the QC lab, rather than a lack of laboratory hardware capability.
3. Improve: Deploying the Optimized State
With the critical root causes identified, targeted interventions were executed to transition from the legacy state to a streamlined, standardized workflow:
-
Inward/Outward Visibility: Replaced unmonitored sample handoffs with strict, digital In-Process Record Registers to track transit and receipt times.
-
Streamlined Methodology: Replaced outdated sample preparation methods that required long settling delays with optimized Analytical Development Laboratory (ADL) methods—specifically protocols ADL/STP/3,4-DFNB-159 and ABTF-161.
-
Labor Coordination: Mitigated testing bottlenecks during shift handovers and staff breaks by implementing staggered cross-training, ensuring continuous, 24/7 laboratory operations.
-
Sample Integrity: Eliminated contaminated sample bottles and vague, handwritten labels by deploying a dedicated stock of pre-cleaned, de-contaminated sample bottles alongside validated labeling protocols.
4. The Results: Shifting to a 6-Sigma Standard
The primary value of this DMAIC case study lies not just in reducing the average processing time, but in drastically reducing process variance.
Before the interventions, sample analysis was highly unpredictable, with some samples taking upwards of 120 to 180 minutes. Post-intervention, the variance was minimized, creating a highly predictable, narrow distribution:
-
Cycle Time Reduction: Average sample analysis time dropped from a 90-minute average (75-minute sample mean) to a sustainable 44-minute average, well below the 60-minute maximum limit.
-
Process Capability Shift: The process Sigma level shifted from an unstable 1.44 to a highly capable 6.0.
By replacing laboratory unpredictability with standardized, engineered workflows, the facility successfully unlocked a direct 30% reduction in operational financial costs.
5. Control: Securing Long-Term Sustainability
To prevent the process from reverting to legacy habits, the team established a three-part sustainability framework:
-
Documentation Governance: Mandatory Inward Register logging to capture exact sample transit and analysis times, ensuring absolute traceability.
-
Method Standardization: Ongoing, strict enforcement of the newly revised testing procedures (ADL/STP/3,4-DFNB-159 and ADL/STP/ABTF-161).
-
Rigorous Audit Plan: A weekly audit schedule led by Dhiren Patel and Rehan Shaikh to continuously validate GC (Gas Chromatography) methods and ensure ongoing alignment with the master Quality Plan.
Scaling the Blueprint
The methodologies established in this project serve as a verified blueprint for operational efficiency across the wider organization. The next phase of the operational excellence rollout involves replicating this exact DMAIC framework to optimize Finished Product GC analysis under the direction of Dr. Deepak Kadam.